this post was submitted on 26 Sep 2024
517 points (94.5% liked)
Games
32168 readers
1291 users here now

Welcome to the largest gaming community on Lemmy! Discussion for all kinds of games. Video games, tabletop games, card games etc.
Weekly Threads:
Rules:
-
Submissions have to be related to games
-
No bigotry or harassment, be civil
-
No excessive self-promotion
-
Stay on-topic; no memes, funny videos, giveaways, reposts, or low-effort posts
-
Mark Spoilers and NSFW
-
No linking to piracy
More information about the community rules can be found here.
founded 1 year ago
MODERATORS
you are viewing a single comment's thread
view the rest of the comments
view the rest of the comments
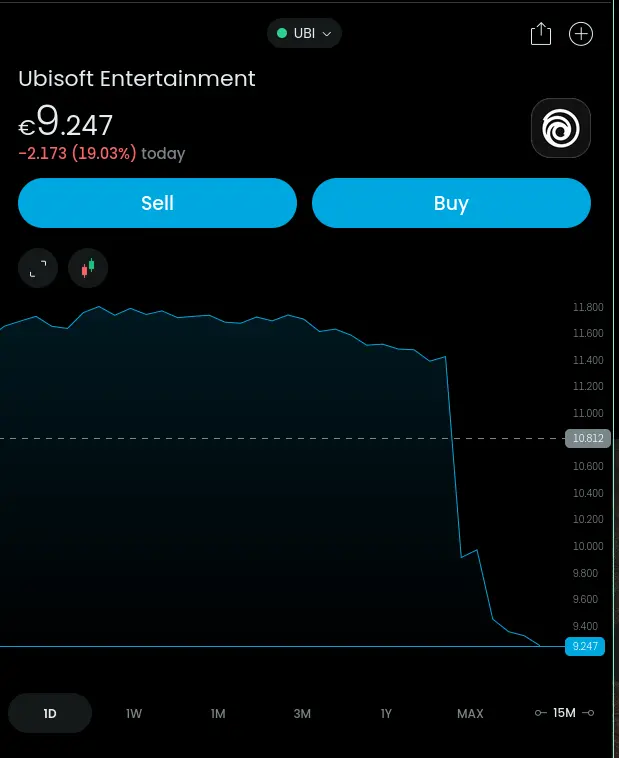
Now do a 5 year graph and realise it's kinda back to pre pandemic levels.
hm.. not quite.. but it certainly has seen some ups and downs, that are larger than what happened this morning. This is a graph of "all time"
It would be cool if these graphs could be inflation adjusted.
That's incredibly easy to do on any analysis platform.
Analysis schmanalysis
WSB detected :)
This thread is like a lesson in the importance of x and y axes range in time series plots
Yes, but it is not acceptable in today's capitalism. Only the growth of growth matters.
If the line does not go up enough, the company is failing.