It depends on the expected functionality. You can check the existing features here:
➡️ https://labplot.org/features
We are currently working on expanding #LabPlot's functionality in these areas:
▶️ Live Data Analysis
▶️ #Python Scripting
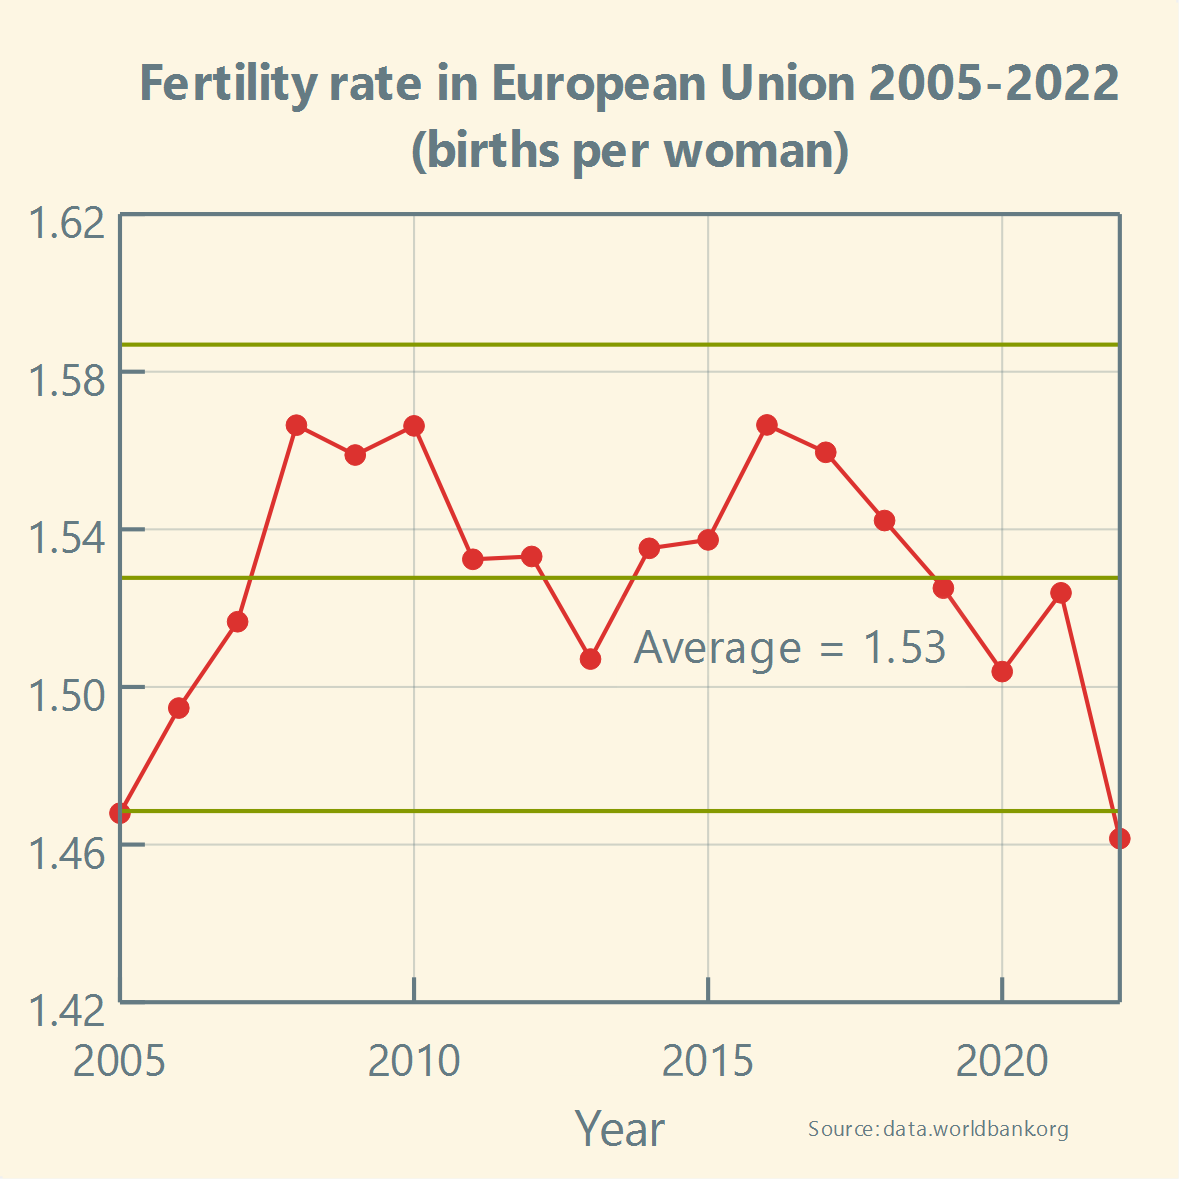
▶️ Statistical Analysis
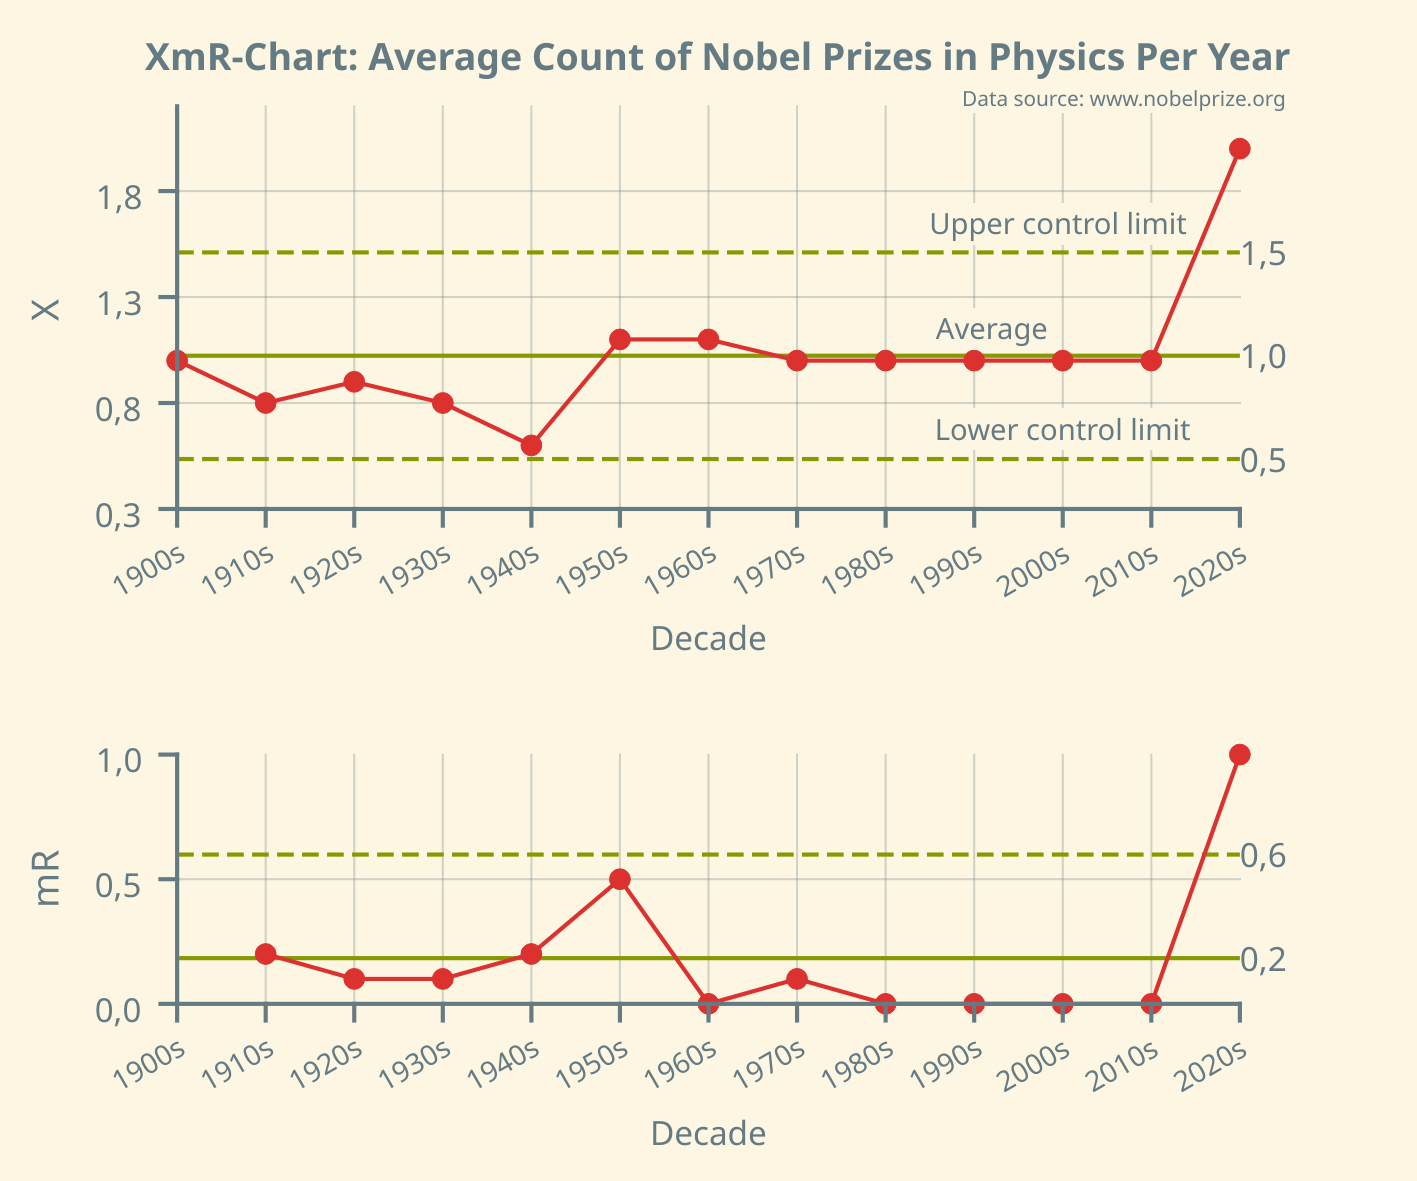
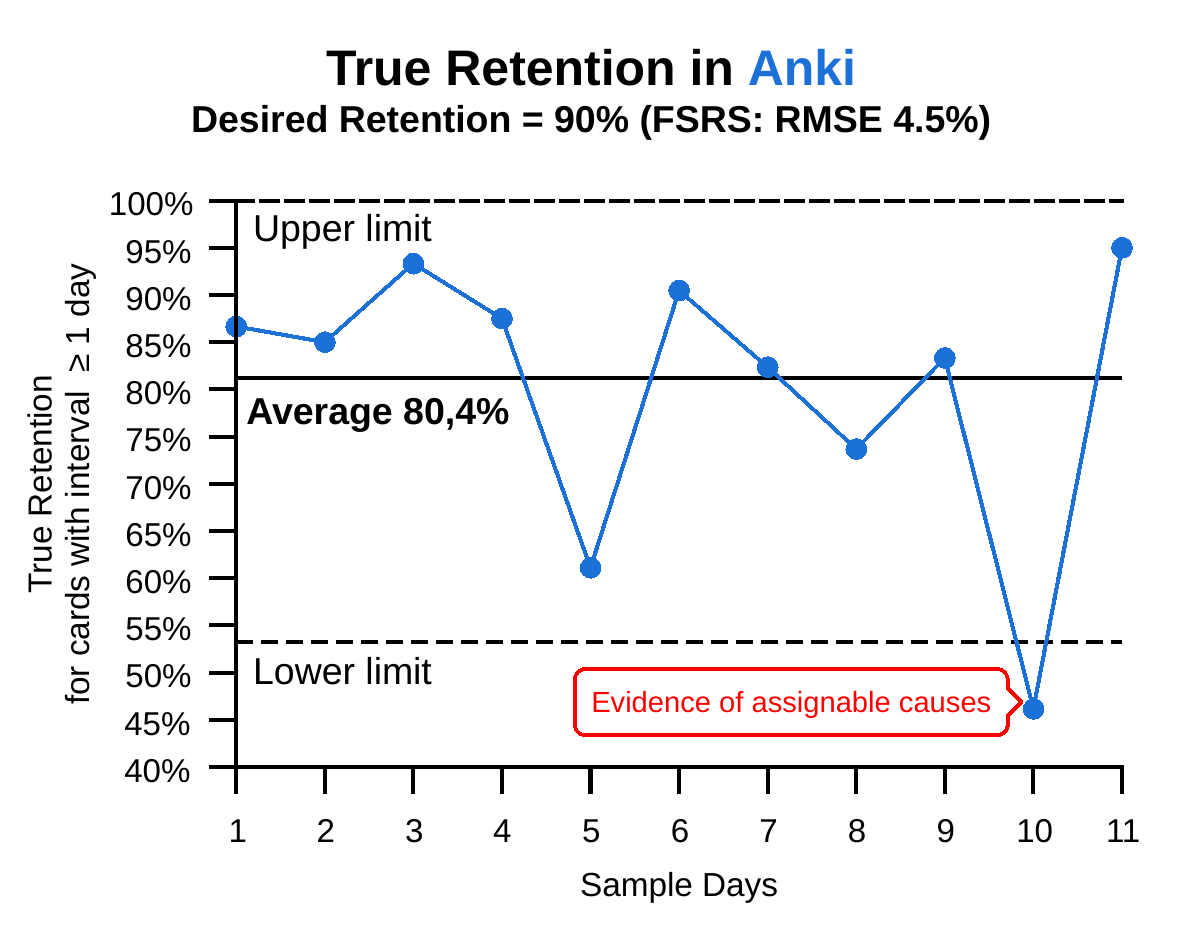
▶️ Quality Improvement Charts
@IrritableOcelot
Thank you for your feedback. Have a look at LabPlot's features, esp. the section on data analysis and statistics. More to come soon.
➡️ https://labplot.org/features