Ye Olde Drain Clog
this post was submitted on 05 Sep 2025
442 points (100.0% liked)
Data Is Beautiful
8776 readers
9 users here now
A place to share and discuss data visualizations. #dataviz
founded 4 years ago
MODERATORS
Pubisycles
It looks a lot like the inverse of flow visualization with smoke or liquid. I guess that's not coincidence?

Not a Physicist, so guessing a little. Both seem turbulent/chaotic systems that rely on the previous state. Each part of a dynamic flow/bike trajectory are small fractals of the initial instability/configuration. A bike is designed to steer straight - counter-steering - while moving, so it is unstable around the line/curve. On the other hand, fluid tend to become unstable at the slightest disturbance and if pushed forward, goes into a oscillating state that breaks up into eddies. I would guess that the bike's forward instability gets exponentially higher at lower speeds, and the bike trajectory lines is not pushed forward as with moving fluid above, so the bike shows another turbulent/chaotic fractal system with a different starting configuration. ..I think ;-)
That is quite obviously my ear hair.
If this is a Rorschach test, I'm seeing Victorian pubes
Pubic extensions
I wondered why I was hungry
it's unexpectedly symmetrical, although i guess the "harmonic" of the bicycle explains that.
Symmetrical up/down? Or do you mean almost periodic right to left?
well since it's a top-down diagram i guess you can say up/down. but right/left is probably more accurate.
I don't know. I expect it to be symmetrical in that direction. Why should it behave different tilting left than right? It being periodic is much more unexpected to me. It makes sense but, without really thinking about it, I would have expected it to be more chaotic.
It's entirely expected. The anomalies are going to be on the furthest left and right; Bikes that fall down right away or ones that stay up longest. The average would be the densest area - bikes that performed "okay." The symmetry is also an expected function with the only options for the wheel to turn being left or right.
If these were not standardized releases, meaning, the energy used to push the bike varied from one to the next - say, because a person was pushing them and not a machine with a defined load - then it explains the short vs. long distances, however that would be normalized even with a predefined load and look similar to this... just bigger distances.
Bikes aren't symmetrical though, with the drive-train to one side, so you'd think there'd be a more noticeable bias in one direction. Guess it's a very minor effect.
I dug up the actual paper (Cook, 2004) and it turns out the bicycle was symmetrical... and, in fact, entirely virtual.

It's a plot of a computer simulation, rather than records from a real-world physical experiment.
A bicycle is composed of four rigid bodies: the two wheels, the frame, the front fork (the steering column). Each adjacent pair of parts is connected with a joint that allows rotation along a defined axis, and the wheels are connected to the ground by requiring that their lowest point must have zero height and no horizontal motion (no sliding).
So the simulation has a lot of simplifications from reality, and the picture tells us more about the simulation model than it tells us about the real world. It is a pretty picture, though.
Here's the paper reference:
Cook, M. 2004. It takes two neurons to ride a bicycle.
(I couldn't get it from the Cook's Caltech site, but I found a copy elsewhere.)
The interesting thing in this situation is that it curved at all.
The fork is bend so the bike automatically counter-steers against gravity. As long as the speed is high and the wheels are spinning (centripetal/symmetry forces), it will tend to steer in a straight line. So the spinning wheel and the bend, makes the bike run upright. The bend has a name, but I forgot..
A personal art project from the ward.
I want to repost this but make the title
Paths of 800 unsuspecting bicyclists being pushed until they fall over
Why does this look like my hair
Are you a bike Medusa?
800 of the same bicycle
if it was 800 different, you'd get a lot more noise
The upper half has more circular tracks. Wonder if Coriolis forces caused the minor differences.
Almost certainly not, the coriolis effect is so small on this space and time scale it's barely measurable even with advanced equipment.
Edit: also from other comments the bike is virtual anyways lol
Neat. How well controlled was the push—did they push them or did a machine?
It's simulated.
Probably
But how was the bike pushed? Was it pushed by an imperfect human, or by some sort of contraption?
It was done inside a physics simulation.
So it's worthless? Not sure how to value virtual simulations of real world physical behaviour when it's used to show something cool.
Only because it is simulated? Pushing the same bike 800 times with the same force mechanically and measuring it doesn't seem to me to net any more applicable knowledge.
How do you learn something from a simulation, isn't it just a way to see if the test you design makes sense? It could go differently in the real world?
It's pretty impressive that they pushed the bicycleIt's pretty impressive that they pushed the bicycle to the right 800 times and half the times it went left instantly.
I think they mean to the right like straight from left to right.
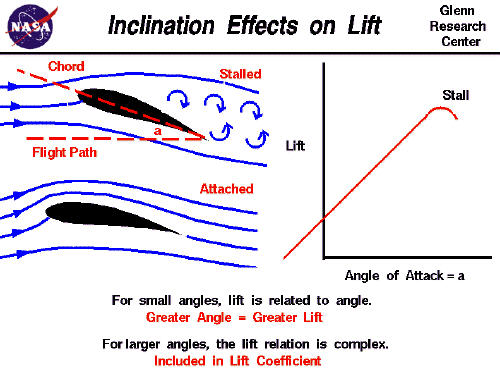
See also: aircraft stall speed
Embedded here:

Now repeat 799 more times
Already done, we're up to our eyeballs in flight test data.
