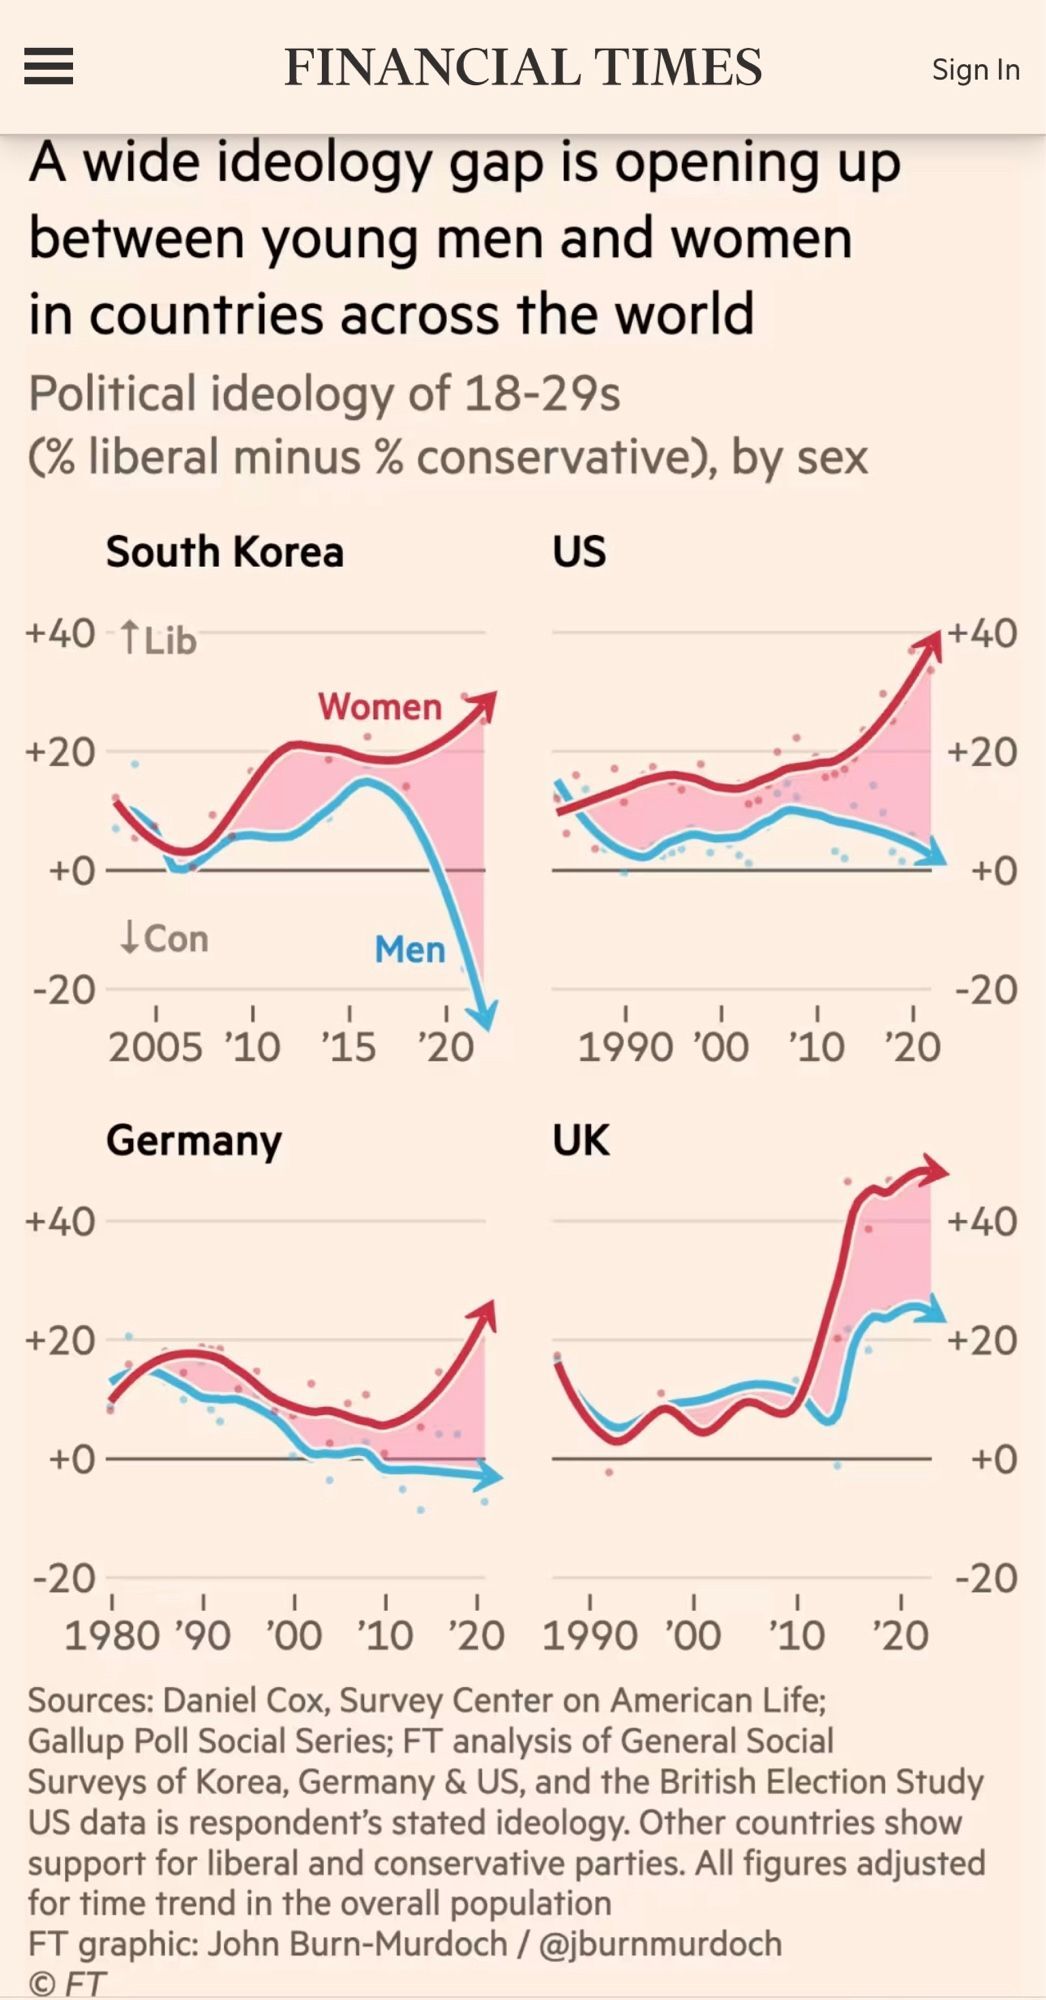
I really don't like that the graphs aren't across the same period of time.
A place to share and discuss data visualizations. #dataviz
I really don't like that the graphs aren't across the same period of time.
I personally don't like how the top left one starts at 2005, unlike every other graph, but they all have the same x scale. (I nitpick things sometimes)
Women have always saved the world
i sorry about women in south korea
That's not an ideology gap, that's feminism vs machism, by the look of it.
And I don't like how sparse the data points are but they went with a wobbly interpolated curve anyway.
Looks like the constant insidious propaganda is working as expected.