this post was submitted on 11 Dec 2024
455 points (97.9% liked)
Data is Beautiful
1285 readers
10 users here now
Be respectful
founded 6 months ago
MODERATORS
you are viewing a single comment's thread
view the rest of the comments
view the rest of the comments

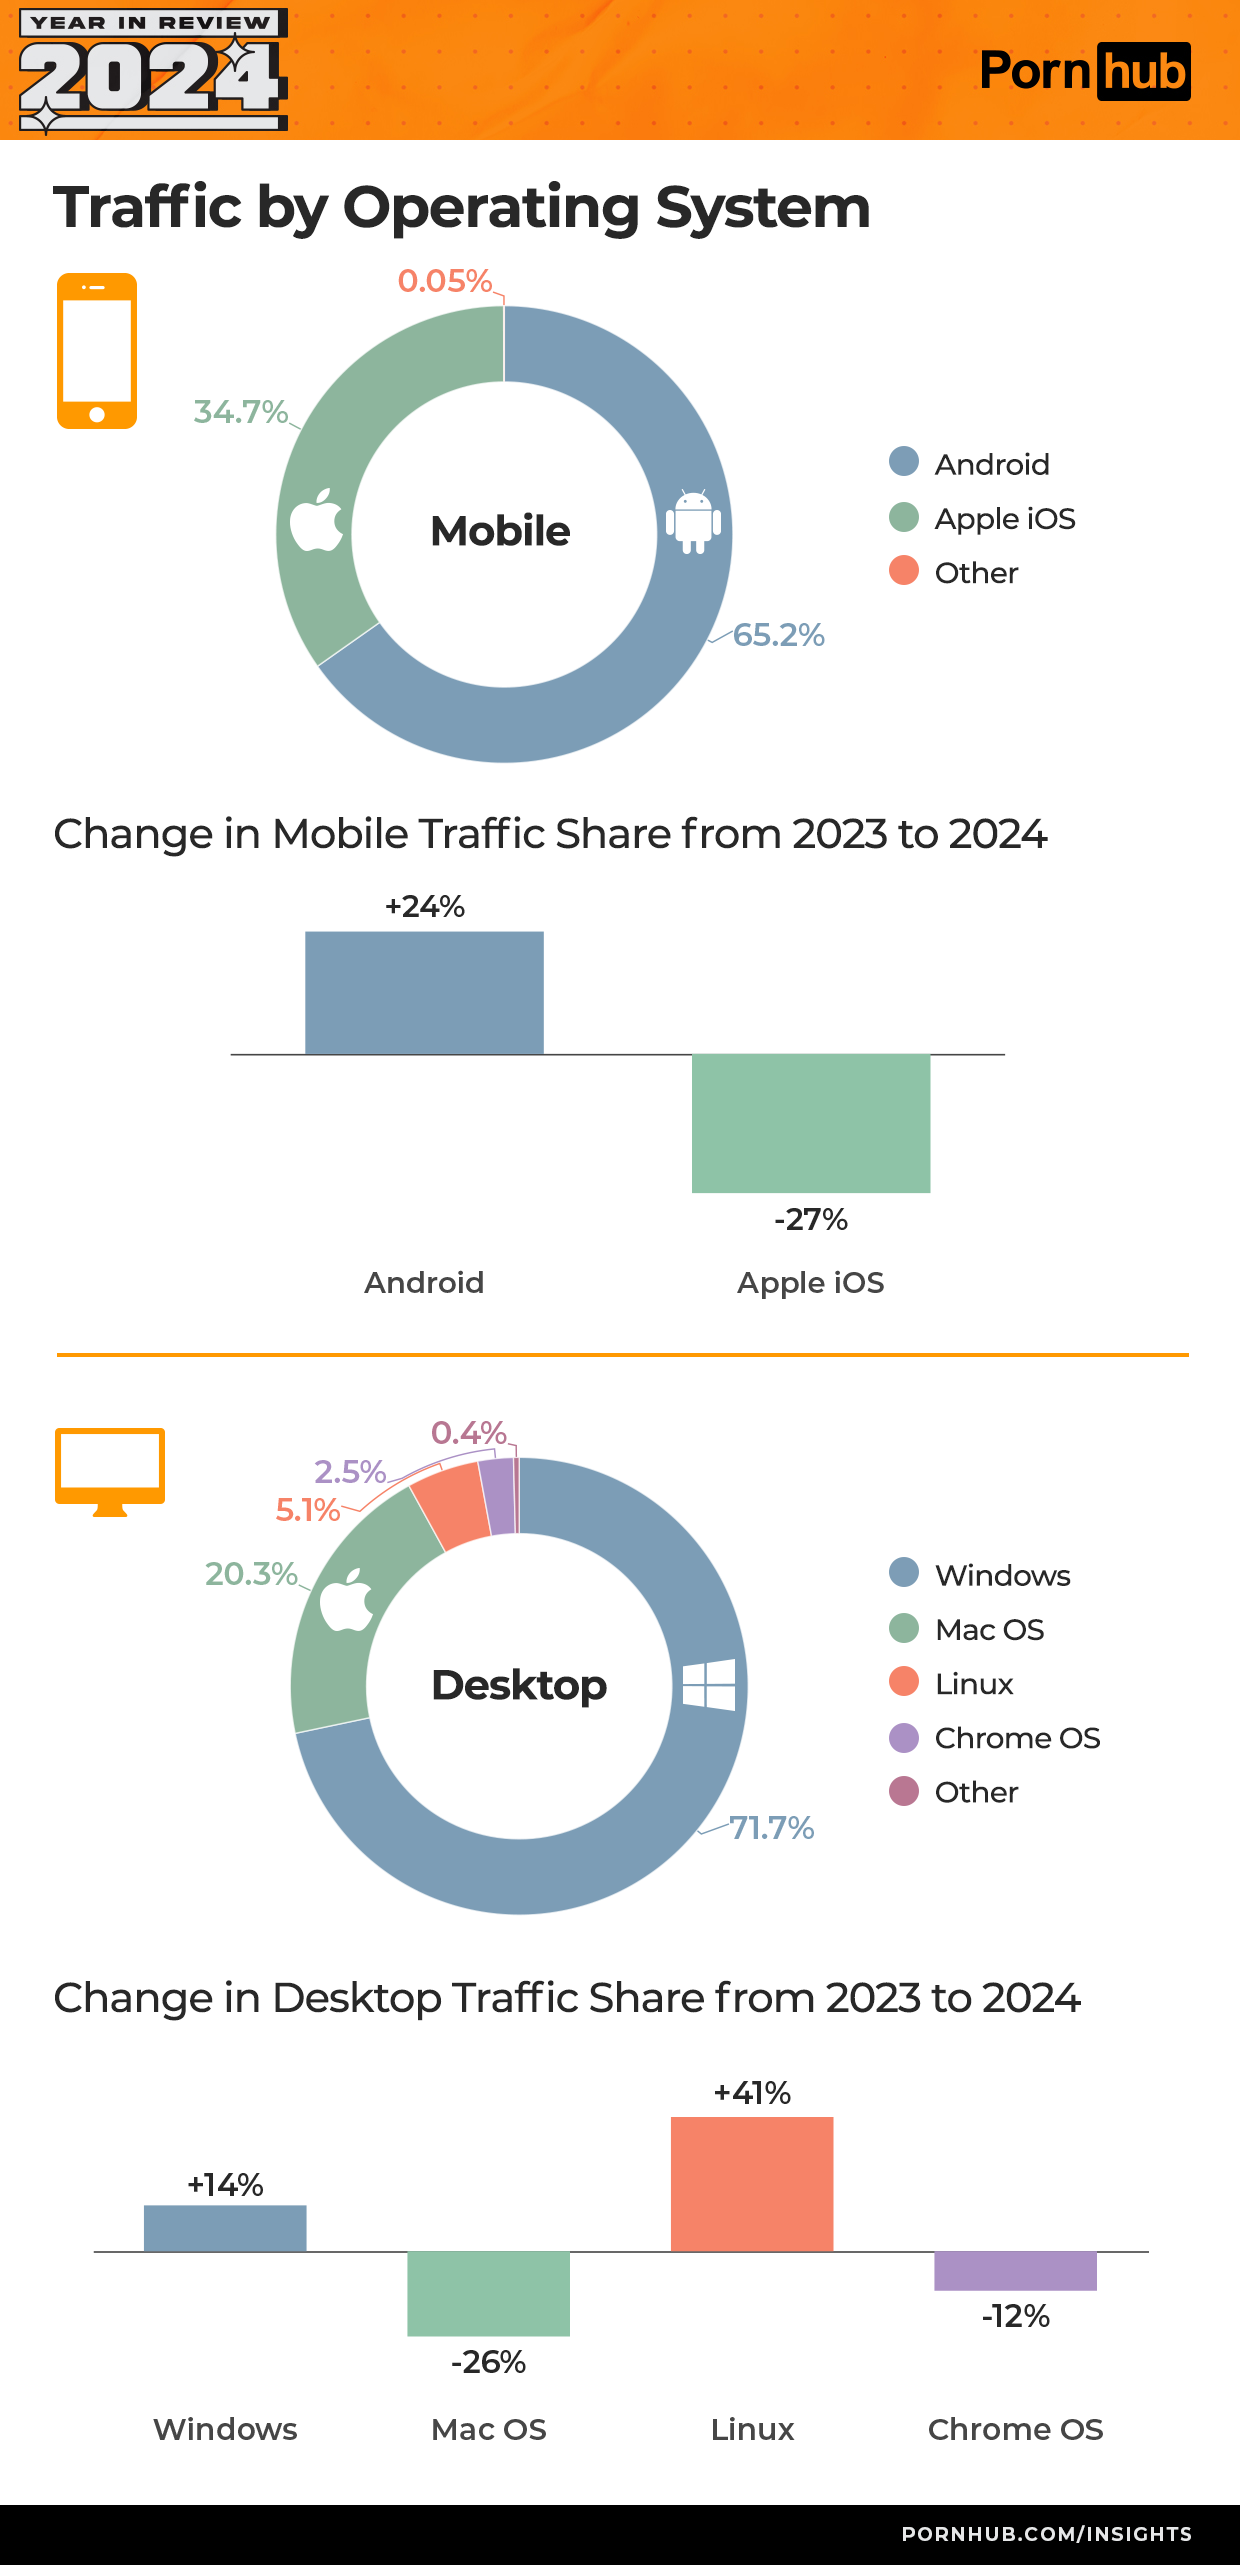
A line graph shows proportional change over time inherently. "50% growth" isn't something that ever justifies being presented as the focus of a graph of any sort.